

Overview
Your reputation status, what to do next and the numbers behind it.
In the dashboard
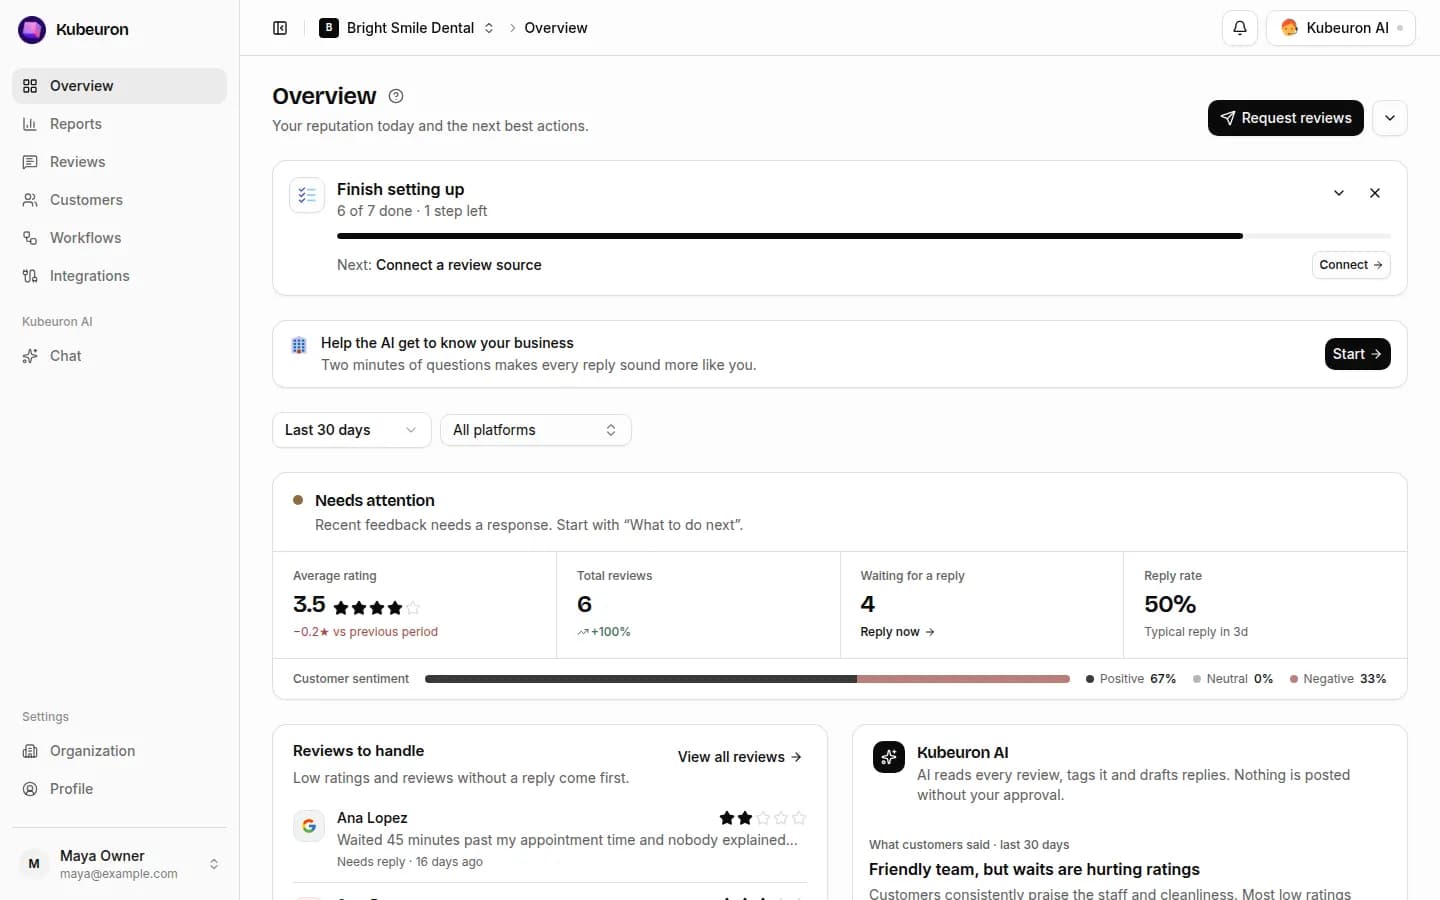
Overview answers two questions: how is our reputation doing? and what should we do next?
Reputation status
A one-word summary of the selected period:
| Status | Meaning |
|---|---|
| Strong | Average of 4.6★ or higher, nothing urgent |
| Good | Healthy, with room to improve |
| Needs attention | A low rating is waiting for a reply, the average is under 4.2★, or the rating dipped |
| At risk | Average under 3.5★, or down 0.5★ or more on the previous period |
Below it are four numbers — average rating, total reviews, reviews waiting for a reply and reply rate — and a bar showing customer sentiment.
Kubeuron AI
A summary of what AI has done: how many reviews it has analysed, how many reply drafts are waiting for you and when your reputation was last scanned. Kubeuron AI in the header opens the assistant, which answers questions about your reviews. See AI in Kubeuron.
What to do next
The three most important items from your roadmap, each with a shortcut to act on it.
Trends and themes
- Rating and review volume by week.
- Themes: what customers praise and complain about most. Select one to read those reviews.
- Platform performance: your rating on each review site, when you have more than one.
Use the date and platform filters at the top to change the period. Download report in the menu creates a printable summary.